
Appearance
Telemetry Data (Logs, Traces, and Metrics)
The DocVal Server can produce highly detailed telemetry data using OpenTelemetry (OTEL). This data includes logs, traces, and metrics, making it easier to monitor and troubleshoot the DocVal Server in production, as well as share debug information when diagnosing issues.
By default, OTEL is disabled. Instructions for enabling and configuring OTEL can be found in the OpenTelemetry Configuration section. You can also learn to configure the DocVal Server's native logging (outside OTEL) in the Logger Configuration. section, controlling log verbosity, format, and destination.
OpenTelemetry Configuration
By default, OTEL is disabled. To enable it, set the environment variable:
OTEL_SDK_DISABLED=false
When enabled, telemetry data (logs, traces, and metrics) will be sent by default to localhost:4318 using the OTLP (OpenTelemetry Protocol) over HTTP. This default endpoint is configurable via the standard OTLP environment variables (for example, OTEL_EXPORTER_OTLP_ENDPOINT, OTEL_EXPORTER_OTLP_TRACES_ENDPOINT, OTEL_EXPORTER_OTLP_METRICS_ENDPOINT, and others).
There must be an application or service listening on this port to receive the data. Most common observability tools can ingest OpenTelemetry data, either directly or via the OpenTelemetry Collector.
Recommended Setup
- Install and run an OpenTelemetry Collector or another OTLP-compatible service.
- Configure the DocVal Server with the relevant OTEL environment variables (see below).
Common Environment Variables
| Environment Variable | Description |
|---|---|
| OTEL_SDK_DISABLED | Set to false to enable OTEL. |
| OTEL_SERVICE_NAME | The name of the service. Defaults to docval |
| OTEL_EXPORTER_OTLP_ENDPOINT | The endpoint to which telemetry data is sent. |
| OTEL_LOGS_EXPORTER | Set to none to disable OTEL-based log exports. |
| OTEL_TRACES_EXPORTER | Set to none to disable OTEL-based trace exports. |
| OTEL_METRICS_EXPORTER | Set to none to disable OTEL-based metrics exports. |
Examples
Write Telemetry Data to Files via the OpenTelemetry Collector
You may wish to write all telemetry data (logs, traces, and metrics) to files, especially for sharing telemetry data for debugging and analysis purposes. One approach is to configure an OpenTelemetry Collector to receive OTLP data from the DocVal Server and export it to .jsonl files.
Below is an example Docker Compose setup:
yml
# docker-compose.yml
version: "2"
services:
  app:
    image: "registry.kurzdigital.com/kta/kta-kinegram-document-validation-service:latest"
    ports:
      - "5000:8080"
    environment:
      ... # Your other environment variables for the DocVal Server. Consult the Installation guide.
      OTEL_SDK_DISABLED: false
      OTEL_EXPORTER_OTLP_ENDPOINT: http://otel-collector:4318
  otel-collector:
    image: otel/opentelemetry-collector-contrib:0.120.0
    volumes:
      # Mount OTEL Collector config (see below)
      - ./otel-collector-config.yaml:/etc/otelcol-contrib/config.yaml
      # Mount directory into which telemetry data will be written
      - ./docval-telemetry:/docval-telemetry
yaml
# otel-collector-config.yaml
receivers:
  otlp:
    protocols:
      http:
        endpoint: 0.0.0.0:4318
processors:
  batch:
  filter: # https://github.com/open-telemetry/opentelemetry-collector-contrib/tree/v0.120.0/processor/filterprocessor
    error_mode: ignore
    logs:
      log_record:
        # Drop logs below the INFO level
        # See https://github.com/open-telemetry/opentelemetry-specification/blob/v1.42.0/specification/logs/data-model.md#displaying-severity
        - "severity_number < SEVERITY_NUMBER_INFO"

# Exporters to log traces, metrics, and logs to separate files with log rotation.
exporters:
  file/traces:
    path: /docval-telemetry/traces.jsonl
    rotation:
      max_megabytes: 1000
      max_backups: 5
  file/metrics:
    path: /docval-telemetry/metrics.jsonl
    rotation:
      max_megabytes: 1000
      max_backups: 5
  file/logs:
    path: /docval-telemetry/logs.jsonl
    rotation:
      max_megabytes: 1000
      max_backups: 5

extensions:
  health_check:
  pprof:
  zpages:

service:
  extensions: [health_check, pprof, zpages]
  pipelines:
    traces:
      receivers: [otlp]
      processors: [batch]
      exporters: [file/traces]
    metrics:
      receivers: [otlp]
      processors: [batch]
      exporters: [file/metrics]
    logs:
      receivers: [otlp]
      processors: [batch]
      exporters: [file/logs]
More Information
OpenTelemetry offers extensive flexibility for customizing how data is gathered, processed, and exported. For detailed instructions please refer to the OpenTelemetry documentation:
- OTEL Environment Variable Specification for a list of environment variables to configure the embedded OTEL SDK
- OpenTelemetry Protocol Exporter for a list of environment variables to configure OTLP
- OpenTelemetry Collector for configuration options and usage of the OpenTelemetry Collector
Prometheus Metrics
The DocVal Server can expose a /actuator/prometheus endpoint for scraping by Prometheus or other compatible monitoring systems.
To enable the Prometheus endpoint, set the following environment variable:
MANAGEMENT_ENDPOINTS_WEB_EXPOSURE_INCLUDE=health,prometheus
Once enabled, metrics are available at /actuator/prometheus. The endpoint exposes standard Spring Boot metrics including JVM metrics (memory, garbage collection, threads), HTTP server request metrics, and system metrics.
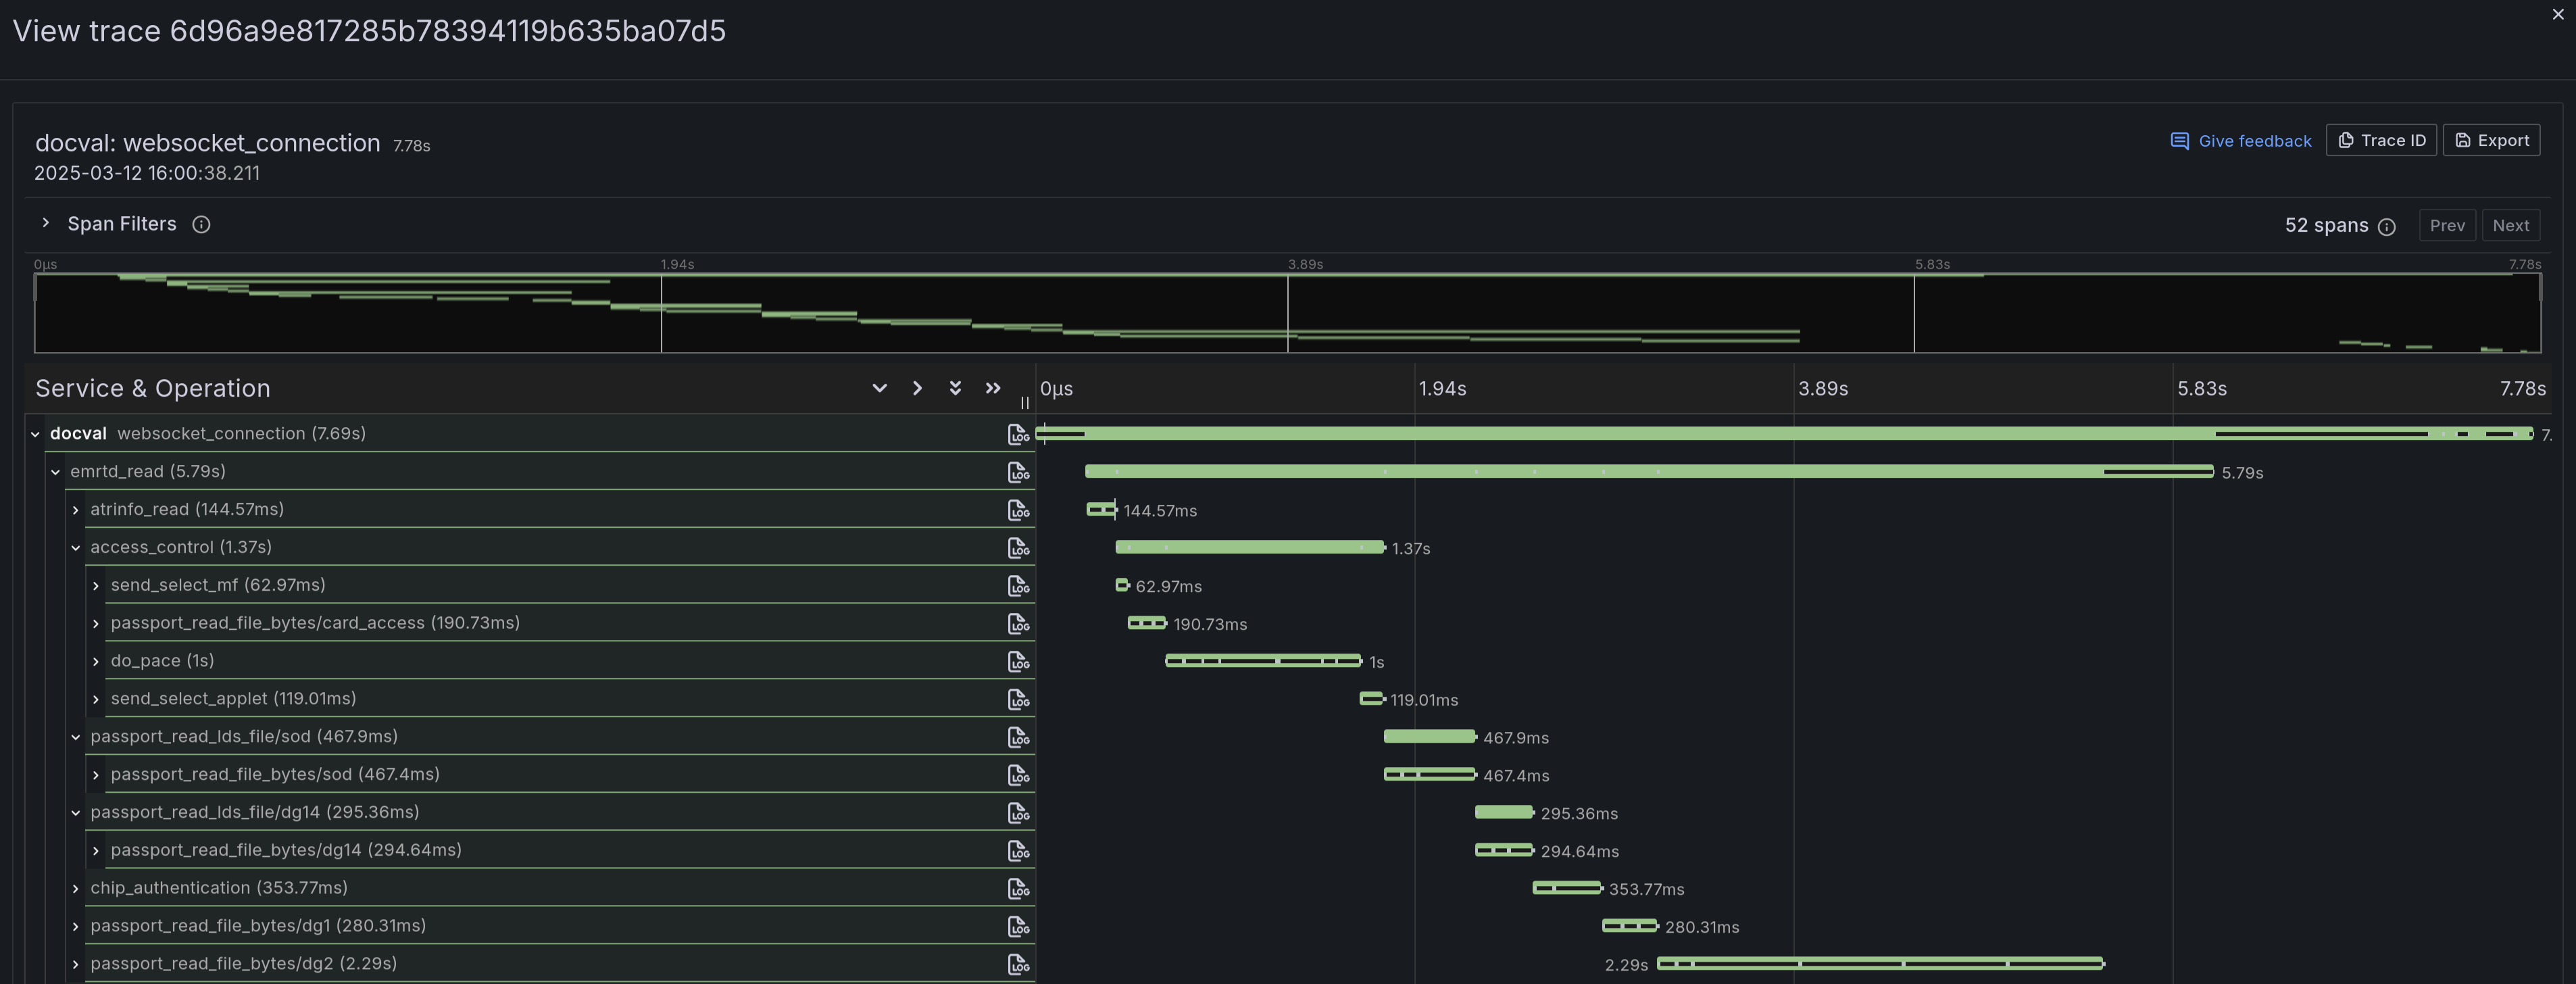
Trace Data
The DocVal Server produces comprehensive trace data for every chip scan, providing a detailed view of the chip communication process. The key span, named emrtd_read, specifically captures the chip reading operation. Traces can be visualized using a variety of OTEL-compatible tools, such as Grafana, Jaeger, Zipkin, and others.
Logger Configuration
Separately from OpenTelemetry, the DocVal Server supports traditional logging using the Logback logging framework (version 1.4.14). By default, logs of level INFO and above are printed to the console.
MDC Fields
The DocVal Server automatically adds the following MDC (Mapped Diagnostic Context) fields to log messages when available:
| MDC Field | Description |
|---|---|
| trace_id | OpenTelemetry trace ID |
| validation_id | The validation ID from the client's start message |
Custom Logback Configuration
If you need more advanced configuration (e.g., filtering or file output with rotation), you can mount a Logback configuration file to /app/logback.xml. Below is the DocVal Server's default Logback configuration, which you can use as a starting point. Refer to the Logback documentation for more details.
xml
<!-- logback.xml -->
<?xml version="1.0" encoding="UTF-8"?>
<configuration>
  <!-- Include Spring Boot's default configuration -->
  <include resource="org/springframework/boot/logging/logback/defaults.xml"/>
  <include resource="org/springframework/boot/logging/logback/console-appender.xml"/>

  <!-- Override default pattern to add MDC fields before the message -->
  <property name="CONSOLE_LOG_PATTERN" value="%clr(%d{${LOG_DATEFORMAT_PATTERN:-yyyy-MM-dd'T'HH:mm:ss.SSSXXX}}){faint} %clr(${LOG_LEVEL_PATTERN:-%5p}) %clr(${PID:- }){magenta} %clr(---){faint} %clr([%15.15t]){faint} %clr(%-40.40logger{39}){cyan} %clr(:){faint}%replace( [trace_id=%X{trace_id}]){' \[trace_id=\]', ''}%replace( [validation_id=%X{validation_id}]){' \[validation_id=\]', ''} %m%n${LOG_EXCEPTION_CONVERSION_WORD:-%wEx}"/>

  <!-- Inject OTEL trace context (trace_id, etc.) for MDC -->
  <appender name="OTEL" class="io.opentelemetry.instrumentation.logback.mdc.v1_0.OpenTelemetryAppender">
    <appender-ref ref="CONSOLE"/>
  </appender>

  <root level="INFO">
    <appender-ref ref="OTEL"/>
  </root>
</configuration>
Additional Logback Encoders and Appenders
- Logstash Logback Encoder is available at runtime.